Insight

Elephant in the room? Size and hedge fund performance
There is much academic and practitioner evidence suggesting that increasing assets under management negatively impacts long-only fund performance. For example, a much-quoted research paper by Jeffrey A. Busse et al concluded that larger long-only funds underperform their smaller counterparts, principally due to holding fewer smaller capitalisation stocks. From a practitioner perspective, Warren Buffett put it vividly in his 2003 Chairman’s letter to Berkshire Hathaway shareholders: “Investment managers often profit far more from piling up assets than from handling those assets well. So when one tells you that increased funds won’t hurt his investment performance, step back: his nose is about to grow.”
There are sound reasons why increasing assets might hamper performance: investment options narrow as assets increase, with larger managers limited to the most liquid investments, and less able to trade around positions. Smaller stocks offer the potential for discovering little-known ‘gems’, as they tend to be less researched by professional investors. To quote Buffett again from a 1999 Business Week interview: “If I was running $1 million today, or $10 million for that matter, I’d be fully invested. The highest rates of return I’ve ever achieved were in the 1950s. I killed the Dow. But I was investing peanuts then. It’s a huge structural advantage not to have a lot of money. I could make 50% a year.” Meanwhile, trading offers the potential of making money from the ‘journey’ as well as the ‘destination’, and can be advantageous during periods of market stress, when the ability to exit positions quickly may be particularly prized.
But do diseconomies of scale also apply to hedge funds? After all, hedge fund managers tend to make a virtue of being different and not necessarily conforming to norms. Perhaps the fee structure of hedge funds, i.e. the charging of a performance fee as well as management fees, creates the incentive for greater discipline on asset-raising compared with long-only funds that tend to only charge management fees. In addition, the studies on size and long-only fund performance tend to focus on equity funds, while hedge funds invest across asset classes. Aurum has been investing in hedge funds since 1994. Over this time, we have amassed a tremendous amount of data on the hedge fund universe. What does this data have to say on the matter? In the case of hedge funds, is size an elephant in the room or a red herring?
Growth of the hedge fund industry
Before addressing the main question, it is worth considering the growth of the hedge fund industry in recent years, particularly in terms of how it relates to the size of funds. Based on Aurum’s proprietary database2, which includes around 8,000 active and closed hedge funds, the number of active hedge funds more than doubled between 2010 and 2018, from around 1,700 to 3,8003. Similarly, the assets managed by these funds more than doubled over the period, from $1.4 trillion to $3.2 trillion.
The graphs below show the growth of the hedge fund industry tracked by Aurum over the past nine years. The number of funds and assets under management are divided into five size groupings: less than $50 million; $50 million to $250 million; $250 million to $1 billion; $1 billion to $5 billion; greater than $5 billion. These groupings are analogous to micro caps, small caps, mid caps, large caps, and mega caps of equities and are similarly labelled in this article. It is interesting to note that, while the industry has grown meaningfully in recent years, the profile of the industry in terms of the size of funds has remained remarkably stable. This applies both to the proportion of funds and the assets managed by funds within each size grouping. For example, considering the largest size grouping, funds with assets of greater than $5 billion accounted for 3.5% of funds in 2010 and 3.1% of funds in 2018, while representing 41.0% of assets in 2010 and 41.5% of assets in 2018.
This trend is rather surprising, indeed somewhat counterintuitive. It would not have been unreasonable to expect the larger size groups to grow more than the smaller groups, given the meaningful growth in the hedge fund industry as a whole. Instead, the size profile of the industry has remained very stable, with growth fairly evenly distributed across the size groupings.
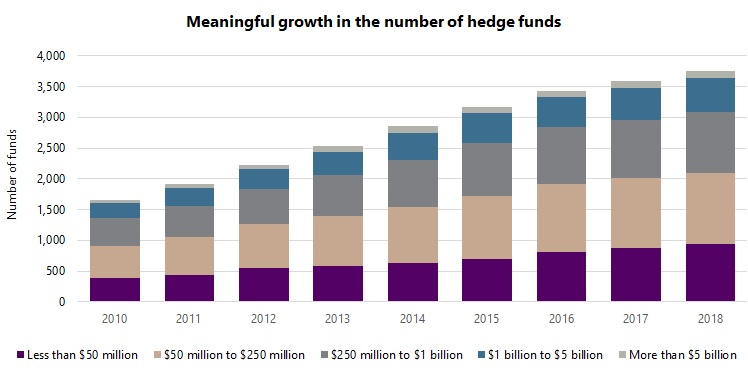
Source: Aurum Research Limited
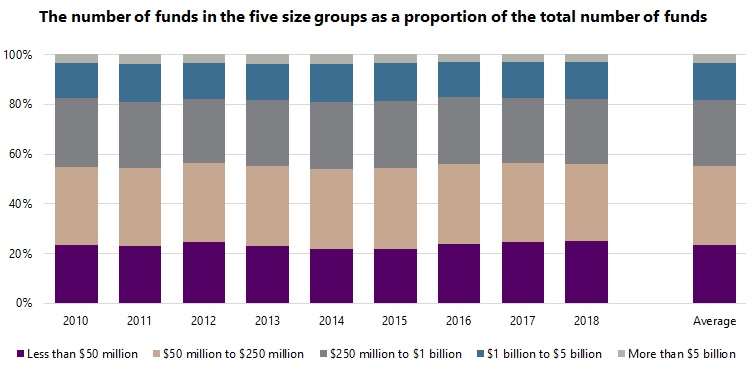
Source: Aurum Research Limited
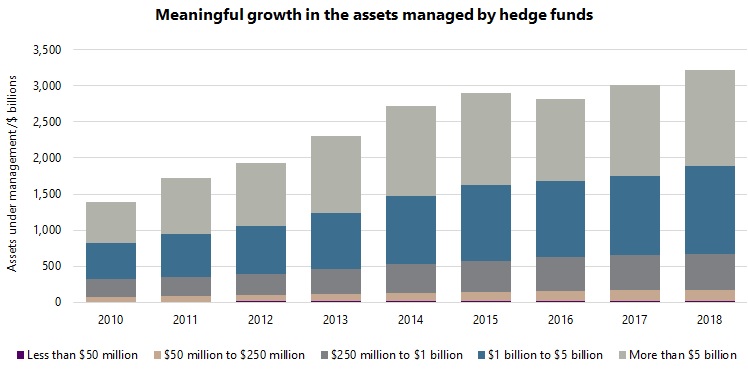
Source: Aurum Research Limited
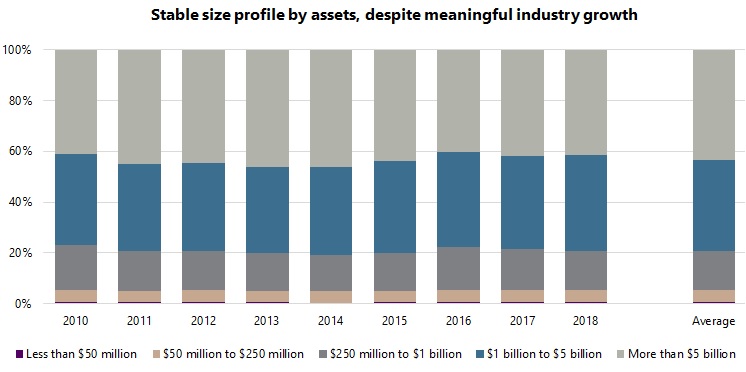
Source: Aurum Research Limited
Size and hedge fund performance
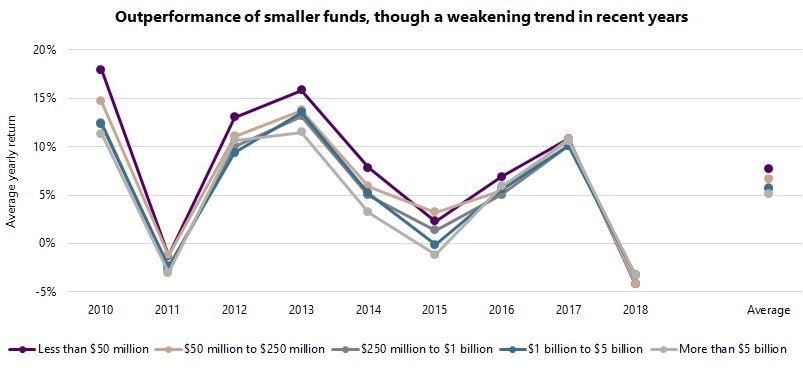
Returning to the main question of the impact of size on hedge fund performance, the graph below shows average4 yearly returns for the five size groupings for the past nine years. While differences are apparent year-on-year, an overall trend is visible: smaller funds outperformed larger counterparts, with the average yearly return for the ‘micro’ group at 7.7%, compared with 6.6% for the ‘small’ group, 5.7% for the ‘mid’ group, 5.6% for the ‘large’ group, and 5.1% for the ‘mega’ group.
While a clear trend exists, the magnitude of the differences in returns are perhaps not as large as one might have expected, especially in the case of funds with assets in excess of $250 million, which represents a practical threshold for many institutional investors, given the typically larger asset bases of institutional investors, and higher operational standards required. The average yearly outperformance of the $250 million to $1 billion group compared with the greater than $5 billion group was relatively modest at 0.6% (5.7% versus 5.1%).
Why might the effect of size be less pronounced than initially thought? Perhaps the existence of performance fees in the case of hedge funds does indeed create some discipline on asset-raising. In addition, the raison d’être of hedge funds is, to a large extent, to participate in smaller, more niche markets, which may make hedge fund managers more sensitive to the limits of capacity. Furthermore, some of the larger funds consist of several (in some cases hundreds of) underlying portfolio managers, so can theoretically be considered as an amalgam of several smaller funds. The founder of a large, well-known multi-strategy fund, consisting of many underlying portfolio managers, describes his fund using the analogy of a flotilla of small but nimble boats, in contrast to one large ship that can have difficulty changing course. It is also important to note that while subject to investment diseconomies of scale, larger funds often enjoy operational economies of scale, such as in the areas of technology and infrastructure, regulation and compliance, and financing.
Another interesting feature that emerges from the data is that the strength of the size ‘factor’ seems to have weakened meaningfully over the past three years. Indeed, there is little to choose between the average yearly returns of the size groups over this period, and parts of the size ‘curve’ have actually inverted, with the average yearly returns for the mid group less than that of the mega group (3.9% versus 4.4%). Is this simply a temporary aberration, or a sign of a more persistent trend? It is too early to say, though it is something worth monitoring and revisiting. However, it is hard to ignore the parallel with the underperformance of the small cap factor in equities in recent years. Indeed, the two may be causally related, as smaller equity funds tend to have greater exposure to small cap stocks than larger funds.
Source: Aurum Research Limited
Risk
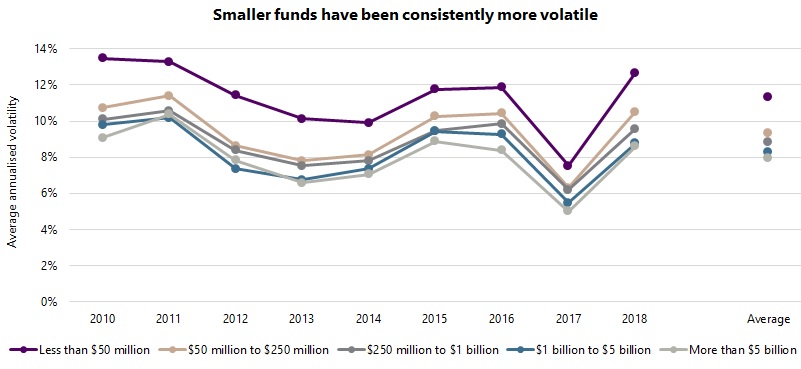
Returns, however, are only half of the story. What about risk? Do similar trends exist for the risk characteristics of different sized funds? Volatility and beta to global equities were investigated to address this question, the results of which are shown in the graphs below. In terms of volatility, a clear trend emerges: smaller funds are more volatile than larger counterparts, with the average yearly volatility for the micro group at 11.3%, compared with 9.4% for the small group, 8.8% for the mid group, 8.3% for the large group, and 8.0% for the mega group. The trend has also been fairly consistent, with little sign of waning in recent years, in contrast to the trend for returns. There is clearly a cost to pay in terms of increased volatility for the higher returns of smaller funds.
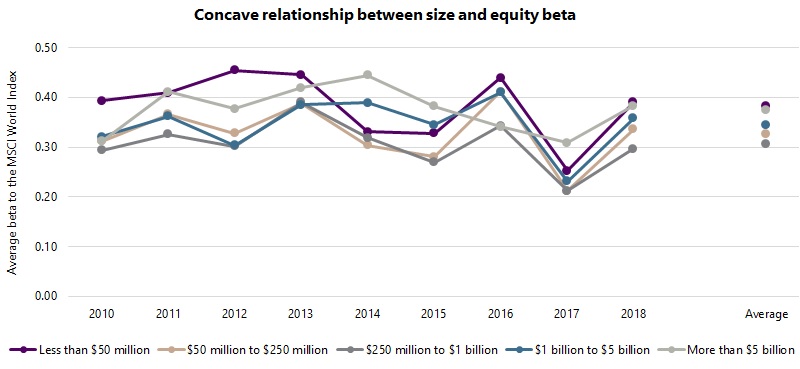
The case of equity beta is rather intriguing: a ‘concave’ relationship exists, whereby the smallest and largest funds exhibit the highest beta, while medium-sized funds the lowest beta. More specifically, the average yearly beta for the micro and mega groups was 0.38, while that for the small and large groups was 0.33 and 0.34 respectively, and that for the mid group was 0.31. Possible explanations for this trend are that smaller funds run with higher market exposures because the managers of such funds are less experienced and/or because lower assets offer the luxury of trading more actively and therefore taking greater risk. Larger funds may also be run with higher market exposures because of the difficulties of managing hedged books at size and the longer term nature of such funds. In contrast, a sweet spot seems to exist for medium-sized funds, whereby mid-sized managers have perhaps matured enough to move away from beta, while the funds are not big enough to be constrained by a larger asset base.
Source: Aurum Research Limited
Source: Aurum Research Limited
Return variation
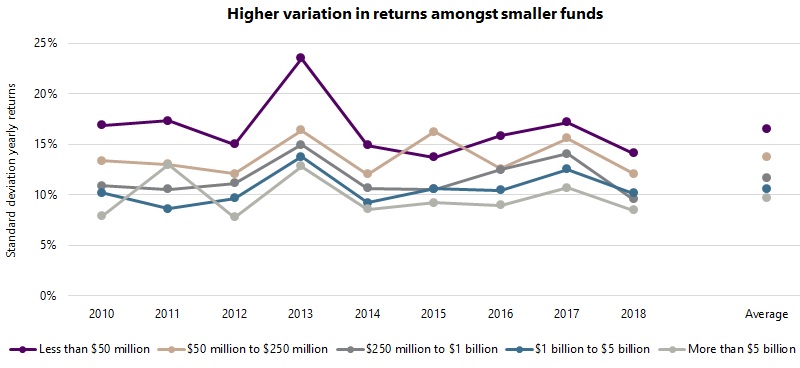
While smaller funds have exhibited higher returns than larger counterparts, what is the range of outcomes within each size group? The graph below shows the standard deviation (a measure of variation) of the yearly returns of funds within the five size groups5. While differences are apparent year-on-year, the overall trend is quite clear: there is meaningfully higher variation in returns amongst smaller funds than larger funds, with the average standard deviation of annual returns for the micro group at 16.5%, compared with 13.7% for the small group, 11.6% for the mid group, 10.6% for the large group, and 9.7% for the mega group. Note that the average standard deviation of returns for the smallest group was 1.7 times higher than that of the largest group (16.5% versus 9.7%). This trend is not altogether surprising: it seems reasonable to assume greater dispersion amongst smaller funds, as smaller funds tend to be more entrepreneurial and thus produce a greater range of outcomes, while there is less scope for differentiation at size.
While smaller funds offer the greatest potential reward, they also pose the greatest risk, not only in terms of the higher volatility and higher equity beta seen in the previous section, but also in terms of higher ‘execution’ risk, given the greater variation in returns. There is clearly greater potential to find ‘diamonds’ amongst smaller funds (in a similar way that there is often more opportunities for equity investors amongst smaller cap stocks), though there is also a greater risk of hitting ‘bogeys’, and therefore increased reputational risk.
Source: Aurum Research Limited
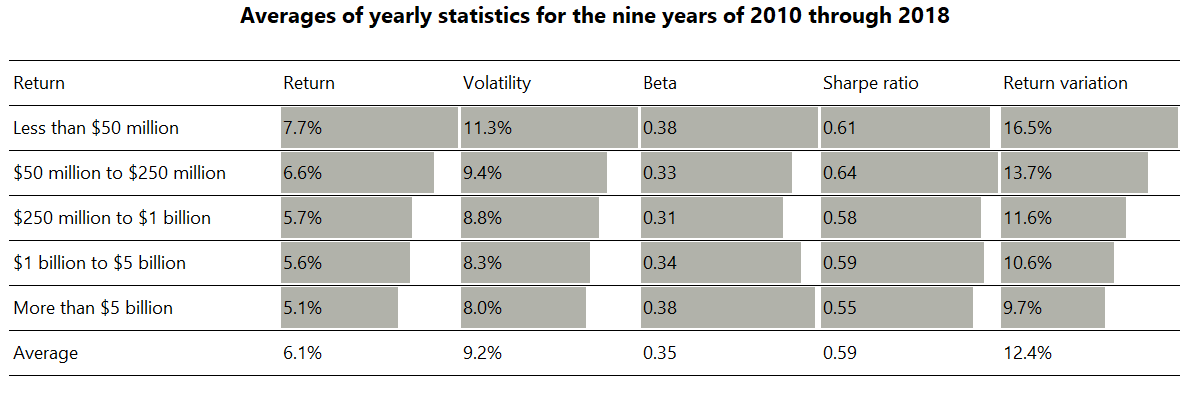
Key results from the analysis above are summarised in the table below. Note that the table includes Sharpe ratios in an attempt to combine the return and volatility statistics (these are derived from the return and volatility statistics presented and the 3-month US dollar LIBOR as the risk-free measure for the nine year period). Sharpe ratios were not presented in yearly form along with the other statistics above because the meaning of Sharpe ratios breaks down when returns turn negative, as they did during 2011 and 2018. While there is a trend for Sharpe ratio to deteriorate with increasing assets, the trend is not uniform, and it turns out that investors looking to maximise Sharpe might wish to target funds with assets of between $50 million and $250 million.
Source: Aurum Research Limited
Conclusion
- Jeffrey A. Busse, Tarun Chordia, Lei Jiang, Yuehua Tang, “How Does Size Affect Mutual Fund Performance? Evidence from Mutual Fund Trades”, June 2014.
- Information in Aurum’s proprietary database is derived from multiple sources, including Aurum’s own research, regulatory filings, public registers, and other data providers.
- Only funds reporting both returns and assets under management on a monthly basis are included in the count and, more broadly, in all of the analysis in this article. The number of funds in the database is around 8,000. This includes both active and closed funds. Amongst these, there were around 1,700 funds reporting returns and assets during 2010 and 3,800 such funds in 2018.
- The average used in this article refers to the arithmetic mean.
- For the avoidance of confusion, the analysis of return variation measures the standard deviation of yearly returns for funds to provide a measure of the variation in yearly returns of funds in the size groups. This contrasts with the analysis of volatility which measures the average of the standard deviation of monthly returns of funds over the yearly time periods to investigate how the volatility of the returns of funds may vary by size group. Essentially, while both analyses make use of standard deviation, one uses it as an ‘internal’ measure for funds (and then considers the average across funds to look for trends), while the other uses it ‘externally’ to compare across groups of funds.


