Insights
A guide to hedge fund fees and redemption terms
In summary
Investors determine whether hedge fund fees and redemption terms are appropriate through the manager selection process. Consideration is given to whether a fund’s terms reflect the manager’s ability to efficiently run their business, and to deliver consistent, high-quality returns.
In this piece we explore how and why hedge fund fees and redemption terms differ across strategies, fund sizes and manager locations.
According to Aurum’s Hedge Fund Data Engine[1], the highest average fees are typically charged by managers based in Asia, and by those running statistical arbitrage, global macro and multi-strategy funds. Meanwhile, funds with the lowest fees are run by European managers and by those running long-biased strategies with elevated beta, and risk premia which aims to cost-effectively replicate existing strategies.
Certain event-based strategies and those focused on credit, with larger AUM, or that are managed from the US, generally have longer redemption periods. Risk premia or CTA strategies, those with smaller AUM, or that are managed from Europe, have the shortest redemption periods.
For investors, terms can meaningfully impact the suitability of a fund. Indeed, the impact can be so profound that funds with certain terms are simply not considered.
About Aurum
Aurum is an investment management firm focused on selecting hedge funds and managing fund of hedge fund portfolios for some of the world’s most sophisticated investors. Aurum also offers a range of single manager feeder funds.
Aurum’s portfolios are designed to grow and protect clients’ capital, while providing consistent uncorrelated returns. With 30 years of hedge fund investment experience, Aurum’s objective is to lower the barriers to entry enabling investors to access the world’s best hedge funds.
Aurum conducts extensive research and analysis on hedge funds and hedge fund industry trends. This research paper is designed to provide data and insights with the objective of helping investors to better understand hedge funds and their benefits.
Introduction
How important are terms?
One of the key business decisions a hedge fund manager has to make is how to structure their offering: balancing supply/demand dynamics and investor preferences with their own requirements and aspirations.
For investors, terms can meaningfully impact the suitability of a fund. Indeed, the impact can be so profound that funds with certain terms are simply not considered. As such, it is critical for managers to get the balance right, and for investors to understand the reasons that fees and redemption terms vary.
Several factors influence a hedge fund’s fees and redemption terms. Some of those are internal, such as the strategy’s running costs; think staff, technology, office space and service providers. Other factors are external, such as demand for the strategy and how the fund’s terms compare to those of its peers.
What does the manager need to consider?
Setting an adequate management fee gives managers more flexibility to spend on overheads. And having a higher performance fee rewards strong returns. But investors have become more and more cost conscious in recent years, with some precluded from considering strategies whose total expense ratios (“TER”) exceed what may be seen as very modest levels.
Funds that have a longer runway for outflows, through extended notice periods and less frequent redemption dates, will benefit from a capital base with higher duration. This may provide greater cash flow certainty at the management company level. As a result, managers of these funds can focus more on their strategy and potentially explore a wider array of trades and asset classes. But on the other hand, it could render their product unsuitable for investors that need more regular liquidity.
Several factors influence a hedge fund’s fees and redemption terms. Some of those are internal, such as the strategy’s running costs; think staff, technology, office space and service providers. Other factors are external, such as demand for the strategy and how the fund’s terms compare to those of its peers. There is not a one-size-fits-all approach.
How can hedge fund investors assess appropriateness?
Benchmarking is a valuable tool in the hedge fund investor’s repertoire and can be used to determine whether the terms of a fund are reasonable compared to its peers.
Aurum’s Hedge Fund Data Engine tracks a universe of over 3,500 hedge funds representing $3 trillion AUM as of December 2022. We have used this data to analyse fees and redemption terms by primary strategy, sub-strategy, fund size and manager location to examine themes and trends across the industry.
Some important disclaimers about our methodology
- We have excluded any funds that fall into more esoteric sub-strategies, that have unreliable or missing terms data, or that are otherwise uncategorised.
- The data can be presented on an asset-weighted or equally-weighted basis. When using asset-weighted data, larger funds have a greater impact on average figures. However, we have used asset-weighted data in this analysis as we believe it better reflects the industry as a whole.
- Certain terms cannot be modelled using this data. These include tiered or bespoke fee structures, pass-through expenses, soft lock-up periods, and investor-level gates. Where necessary we provide additional written commentary on these based on our experience as hedge fund analysts.
Universe
Terms are reported by $2.4tn of the $3tn industry AUM tracked by Aurum as of December 2022. $1.71tn of the in-scope AUM is managed from the US, $408bn from the UK, $166bn from Asia and $129bn from Europe. Below we break down this in-scope AUM by region, sub-strategy and fund size (in $bn).
REGIONAL SUB-STRATEGY BREAKDOWN
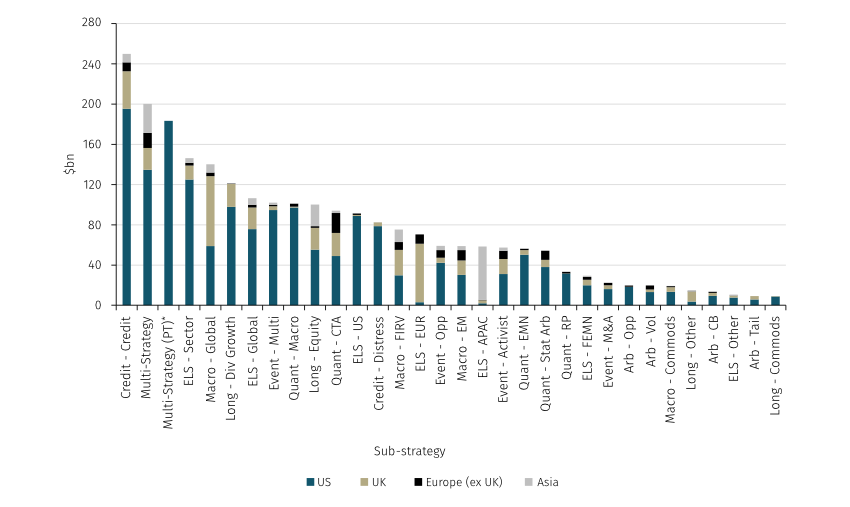
As of December 2022. Source: Aurum’s Hedge Fund Data Engine. *Multi-Strategy Pass-through
REGIONAL FUND SIZE BREAKDOWN
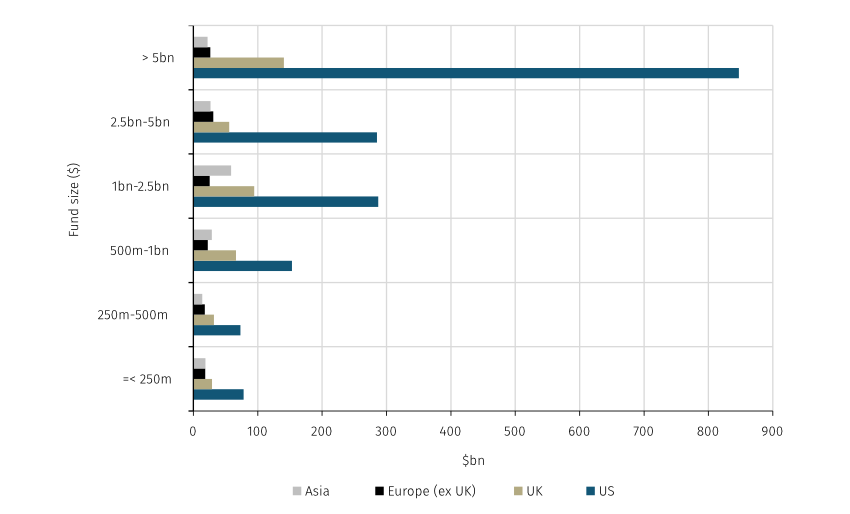
As of December 2022. Source: Aurum’s Hedge Fund Data Engine
Fees
On the whole, certain types of quant funds charge the highest average management fees, whilst long biased and risk premia funds charge the lowest. But there is meaningful variation amongst different sub-strategies as we see below.
AVERAGE MANAGEMENT FEES BY SUB-STRATEGY
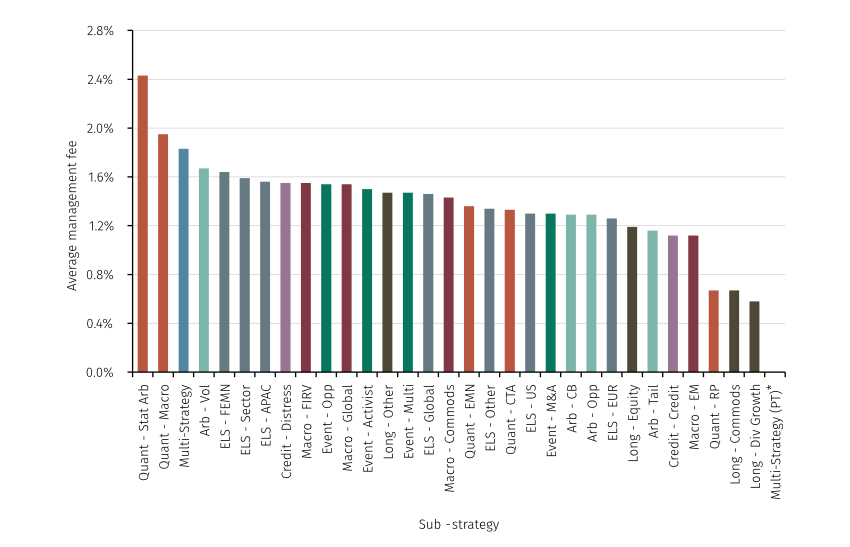
As of December 2022. Source: Aurum’s Hedge Fund Data Engine. *Multi-Strategy Pass-through
What drives higher management fees?
Statistical arbitrage funds charge some of the highest fixed management fees in the industry. These managers tend to have much higher infrastructure and data costs, and are engaged in intense competition for talent with peers. Moreover, in our experience there is a supply/demand imbalance for this particular strategy which makes it very capacity constrained; part of the fee premium could be explained by this.
Somewhat unsurprisingly, multi-strategy funds also charge more. Generally, managers in this group will either receive a conventional management fee or, alternatively, pass through certain costs to the fund that a management fee would otherwise be expected to cover. Multi-strategy funds with a passthrough structure usually don’t have a management fee as well. However, the costs passed through can vary year on year. This is important because, unlike other types of hedge fund manager, multi-strategy firms usually employ a larger group of specialised non-investment personnel in areas such as operations, accounting, data and compliance. They also have a more complex infrastructure compared to single portfolio manager (“PM”) strategies. Both of these factors mean that costs attributable to the firm’s overheads that are passed through can sometimes exceed a fixed management fee. Irrespective of their fee structure, multi-strategy funds generally cost more than others.
Some multi-strategy firms cap the passthrough costs related to overheads or any other expenses that aren’t related to PM teams to control the expense drag on net returns, but others do not. In either case, Aurum advocates for a series of best practices when it comes to passthrough structures to ensure that the manager’s interests are aligned with those of investors.
When are lower management fees charged?
Long-biased strategies are exposed to more market beta, whilst risk premia funds typically seek to replicate existing hedge fund strategies at a lower cost. As such, managers may not need to charge as much to cover fixed overheads.
One other theme we would draw attention to is emerging markets (“EM”) macro, which is at the lower end of the middle band for both management and performance fees. We suggest three possible contributors: firstly, EM macro underperformed during COVID-19, due to factors including a US dollar rally and increased government indebtedness, and this may have forced EM-focused managers to consider fee discounts to attract and retain investors. Secondly, global macro counts amongst its constituents some of the most well-known and longstanding hedge fund managers. These firms may be in a position to charge a premium owing to their experience of navigating multiple market cycles. Thirdly, the EM macro sub-strategy may comprise more funds with a long bias, hence they would charge less.
The impact of size
One pervasive trend we have observed in our data is that asset-weighted averages are in almost all cases higher than their equally-weighted equivalents. This suggests that larger funds charge higher fees across most sub-strategies.
The chart below illustrates average management fees for each primary strategy by fund size. One can clearly see the greater dispersion in management fee rates between different strategies as funds grow bigger.
AVERAGE MANAGEMENT FEES BY FUND SIZE
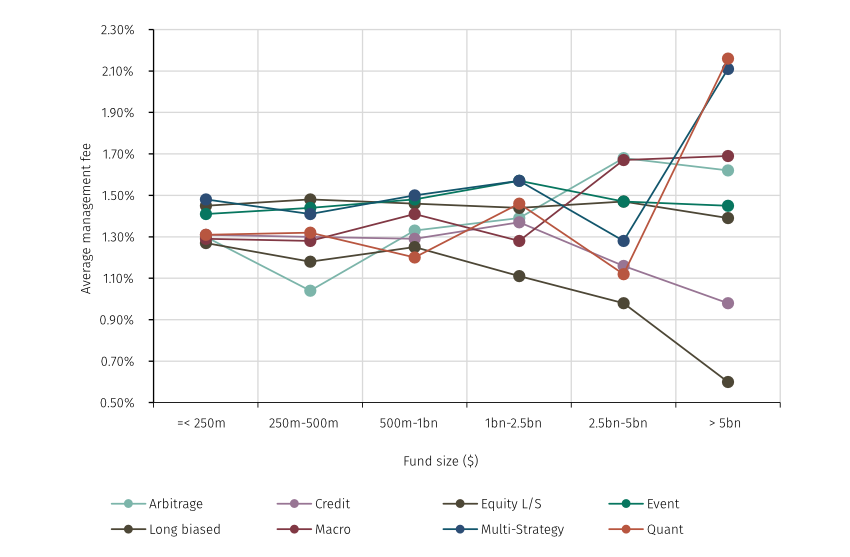
As of December 2022. Source: Aurum’s Hedge Fund Data Engine. Multi-Strategy above excludes pass-through funds.
Smaller funds have less room to manoeuvre
Due to pressure from overheads, smaller managers may lack the flexibility to offer more attractive fees. And if they are asset raising in a competitive market, they may also lack the bargaining power to charge more aggressively. This theme appears to apply to funds with up to $1bn in assets, with variation increasing thereafter.
Larger funds can be more flexible
The highest and lowest average rates for funds >$5bn really highlight how funds evolve and diverge as they grow. These divergent fees also reinforce our prior comments about the relative costs of running different strategies. Separately, we highlight that average management fees for long biased and credit funds tend to reduce as AUM grows past the $1-2.5bn level. This suggests that some managers in these groups might be able to leverage economies of scale better.
But this theme does not persist for all strategies, most notably quant. There are two possible reasons for this: firstly, these managers may be more organisationally complex, hence they charge fees that cater to their higher cost base. As mentioned previously, quant strategies require substantial spending on infrastructure and other technology, hence are often more costly to run. Secondly, these larger funds may have been trading for longer and could be considered more successful, allowing the managers to charge a premium.
Performance fees
Similarly to management fees, the lowest average performance fee rates were attributable to long biased and risk premia funds. Again, this is likely because more of their respective returns are attributable to either wider market movements or attempts to cost-effectively replicate existing hedge fund strategies.
Multi-strategy funds generally charge higher performance fees. For those that do not have a passthrough structure, higher performance fees may be needed to compensate for the netting risk inherent in these multi-PM funds. Netting risk occurs where each PM team is entitled to a payout on their own books, irrespective of the performance of other teams. This can mean that certain teams still receive variable compensation in a year where the overall fund is flat or down. For funds with a full passthrough structure, where investors bear the netting risk, higher performance fees may be a function of supply/demand and past success.
AVERAGE PERFORMANCE FEES BY SUB-STRATEGY
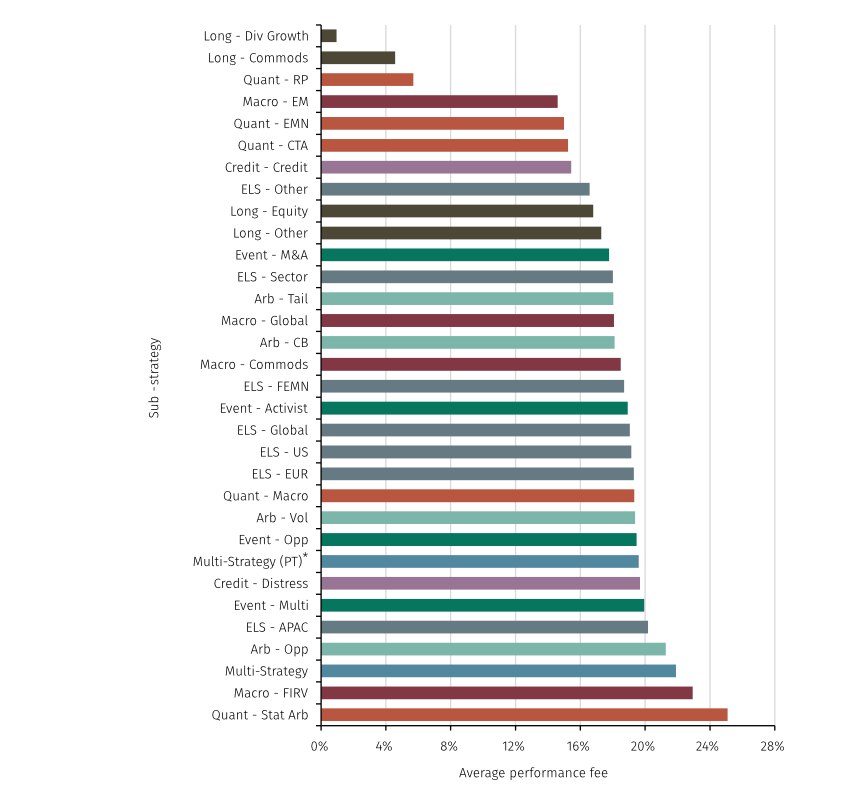
As of December 2022. Source: Aurum’s Hedge Fund Data Engine. *Multi-Strategy Pass-through
We see, to an extent, a similar pattern with performance fees and AUM to what we do with management fees, namely less variation in smaller funds and more variation in larger funds. The very low average performance fees in the >$5bn long biased group are in part driven by a group of larger funds, which is one of the issues encountered with asset-weighted data.
AVERAGE PERFORMANCE FEES BY FUND SIZE
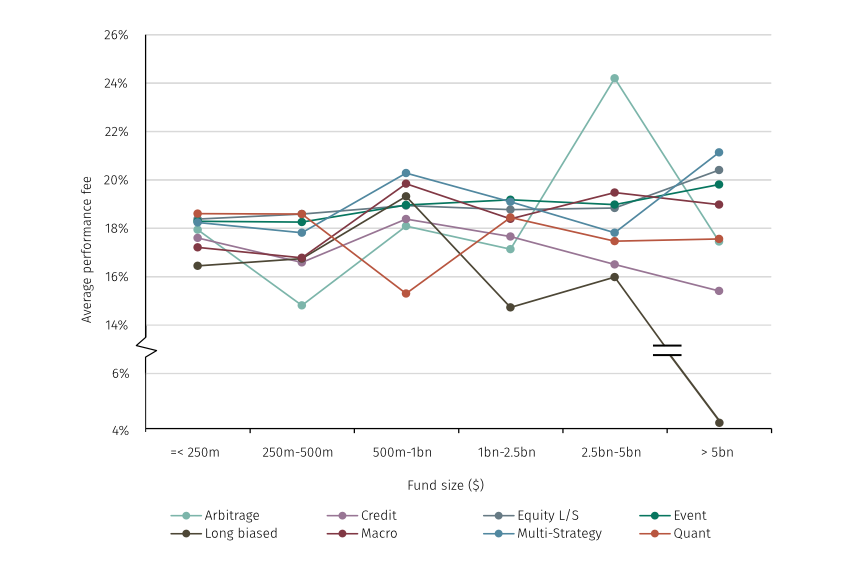
As of December 2022. Source: Aurum’s Hedge Fund Data Engine
The impact of manager location
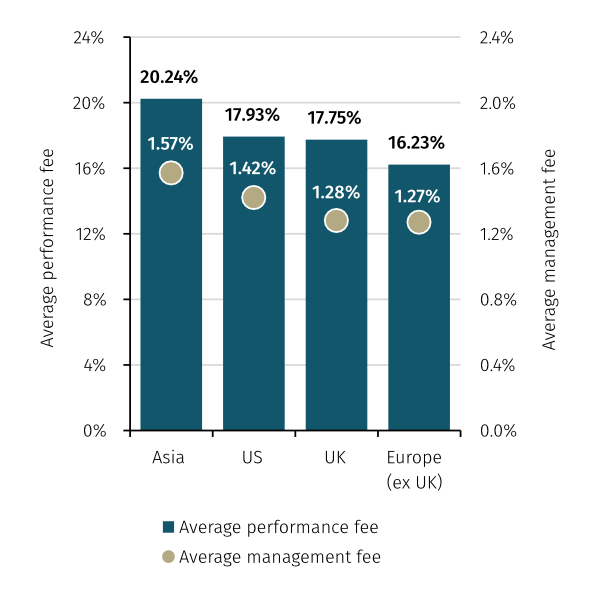
It also appears that management and performance fee rates differ by where the manager is headquartered. On the whole, funds managed from Asia charge higher average fees than any other region. Meanwhile, the cheapest region for investors is Europe ex UK.
Managers domiciled in Asia tend to charge more
We believe there are two main reasons that Asia-focused managers generally charge slightly higher fees. Firstly, the predominant strategies in this region include equity long/short, multi-strategy and macro. The latter two in particular charge higher fees relative to other strategies in each region. Also, there are some very successful macro managers based in Asia who are likely able to command a premium.
Secondly, the Asia hedge fund market is somewhat less mature compared to the US and Europe. There is growing demand for Asia-focused products, but supply has not caught up. There also appears to be a lot of competition for local talent. These imbalances could be contributing to higher fees.
Managers domiciled in Europe tend to charge less
Lower average fees charged by European managers are most likely attributable to regulation designed to protect investors from excessive costs. Aurum’s Hedge Fund Data Engine includes alternative UCITS funds which are subject to extensive rules around expenses, and this is most likely one of the main reasons behind the lower fees observed across the region. Indeed, 51% of the strategies in the dataset that are run by European hedge fund managers are classified as alternative UCITS, so this is clearly impacting the data.
Incidentally, this regulatory environment may also have caused a potential supply/demand imbalance for certain types of more liquid strategy. CTA, which is generally at the cheaper end of the fee spectrum, is one of the single most prevalent sub-strategies in Europe.
Redemptions
Longest redemption periods
As shown below, credit and most event strategies have some of the longest redemption periods in the industry. This makes sense given the lifecycle of some of the trades they are more likely to be participating in. A longer-term capital base would be particularly helpful for activist managers waging multi-year campaigns against portfolio companies, for example. And a distressed credit manager will likely be investing in more illiquid assets. Hence, they would want to be able to spread out redemptions to avoid having to sell these assets quickly at a discount. The outlier in event strategies is merger arbitrage, which can offer slightly better redemption terms. These managers may be active in numerous corporate events in a given year. This means that trade velocity is higher, hence capital does not need to be locked up for as long.
It is a little surprising to see global equity long/short having one of the longest redemption periods. This is because we might expect a typical portfolio in this strategy group to be less complex and more liquid than some others. Looking at the underlying data, there is no large fund skewing the average figure, suggesting that this is indeed a theme. These managers may be less tactical and are instead focused on longer-term ideas. As such they may look to align fund redemption terms with the life cycle of their trades.
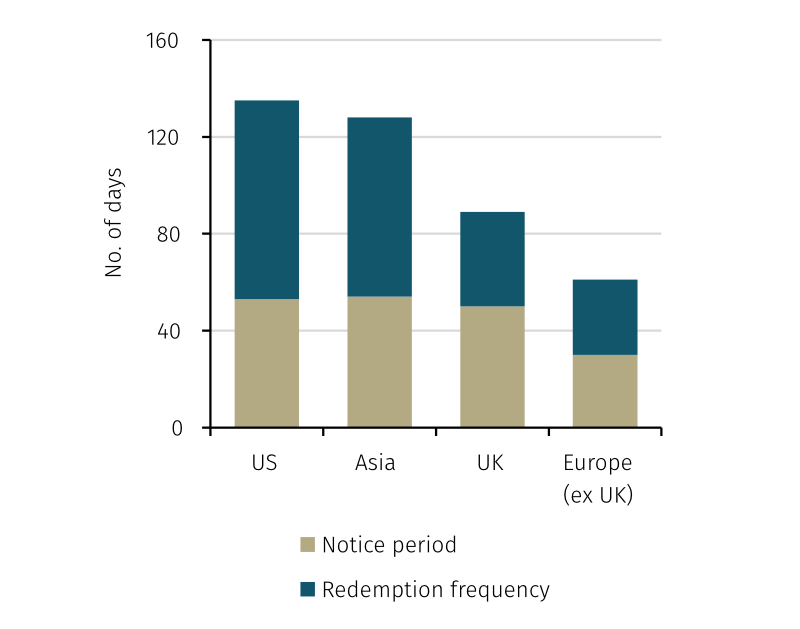
AVERAGE NOTICE PERIOD AND REDEMPTION FREQUENCY
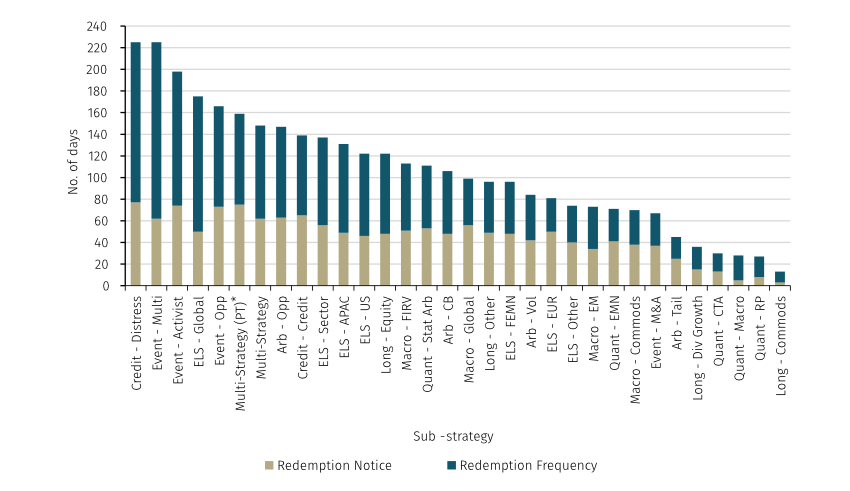
As of December 2022. Source: Aurum’s Hedge Fund Data Engine. *Multi-Strategy Pass-through
Note: dealing frequency has been converted into days, for example monthly dealing would equate to 30 days and quarterly dealing to 90 days. This effectively represents the typical amount of time between each dealing date.
Shortest redemption periods
At the other end of the spectrum, none of the strategies with the shortest redemption periods are unexpected. This is because the underlying portfolios are generally perceived to be very liquid with shorter time horizons.
Away from the longest and shortest redemption periods, we still observe a lot of variation. At the shorter end are tail protection, merger arbitrage and commodity funds, with opportunistic event and multi-strategy at the longer end.
Multi-strategy funds
Over the past five years, several large multi-strategy managers have lengthened their funds’ redemption terms. They have moved away from historically common arrangements – such as quarterly/90 – and have introduced various mechanisms to improve capital stability. These mechanisms have included investor-level gates, typically 25% quarterly or less; rolling soft or hard lock-up periods lasting 12 months or longer; and fund-level gates that trigger if aggregated redemptions exceed a specified percentage of fund assets each dealing day, sometimes less than 10%. These terms vary by manager, so are very difficult to standardise and model and have not been factored into the data used in this analysis. As such, the total redemption periods shown in the above data may not accurately represent the total length of time it takes to redeem a position. Investors must understand exactly how the various redemption mechanisms work to ensure that potential asset-liability mismatch risks are mitigated. This can be aided by thorough review of fund offering documents.
The impact of size
According to our data, redemption terms vary materially based on fund size as well as strategy. Below we observe a lengthening of average total redemption periods as funds grow:
AVERAGE TOTAL REDEMPTION PERIOD
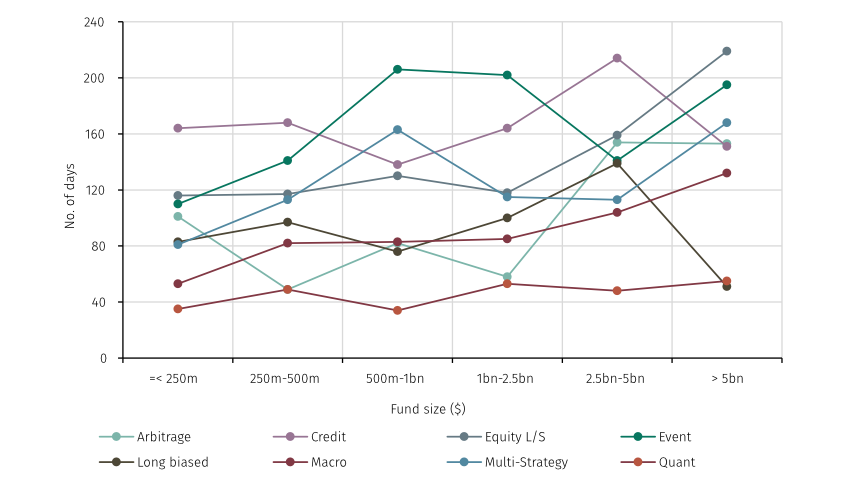
As of December 2022. Source: Aurum’s Hedge Fund Data Engine
There is meaningful variation between the highest and lowest average redemption periods across all fund sizes. This contrasts with management and performance fees where variation increases with size. It therefore appears that small and medium sized managers either prefer, or are more able, to adjust redemption terms in a way that they cannot do with fees.
Shorter end
Quant strategies on the whole have the shortest average redemption periods in the industry. This holds across all sizes of funds. But different sub-strategies within quant can vary meaningfully: CTA and risk premia funds have very short average redemption periods whilst statistical arbitrage funds have longer ones. All of these strategies trade in liquid markets and have very regular turnover. As such, the variation in redemption terms is not driven by asset-liability mismatch considerations. Instead, it is more attributable to supply/demand: the most successful statistical arbitrage funds are very capacity constrained and generally hard-closed. Investors accept less regular redemption terms in order to access this strategy.
Longer end
At the other end, event and credit funds have some of the longest redemption periods across different AUM sizes. Unlike other strategies, we do not see a meaningful increase in redemption timeframes for larger funds in these two groups. This suggests that these strategies have less flexibility with their redemption terms, consistent with our prior comments about trade duration and portfolio liquidity.
Larger funds generally have longer redemption periods
Why would larger funds have, on the whole, longer redemption periods? At a high level, it is in the pursuit of business stability, PM retention, and better financing arrangements with market counterparties. Also, smaller funds may not have as much flexibility to set desired redemption terms because they are more likely to be asset raising compared to large funds that may be oversubscribed. This is primarily a supply/demand dynamic: there is currently a substantial amount of investor demand for larger and more proven funds. Given that a number of these funds have already amassed a considerable asset base, their managers have more freedom to set terms.
The impact of region
The data also shows us that manager location plays a role in redemption terms.
Strategies with the longest total redemption periods are generally managed from the US with an average of 135 days. The primary hedge fund type in the US is multi-strategy, representing $318bn, or over 10% of the global industry, with these funds generally having longer redemption periods.
Strategies managed from Europe ex UK have the shortest redemption periods with an average of 61 days. We are also not surprised by this. AIFMD has forced the European hedge fund industry to become more investor friendly, with liquidity being a core tenet of this regulation. Alternative UCITS funds generally have daily or weekly dealing, and we can clearly see the impact of this in the data.
Conclusion
The highest average fees are typically charged by managers based in Asia, and by those running statistical arbitrage, global macro and multi-strategy funds. Meanwhile, funds with the lowest fees are run by European managers and by those running long-biased strategies with elevated beta, and risk premia strategies which can be less complex. However, unless a manager is well-tenured and a proven money maker with a sizeable roster of prospective investors, they may find it hard to price their product aggressively.
Similarly to fees, redemption terms are clearly impacted by a combination of fund size, manager location and, of course, strategy. Funds running credit or certain event strategies, with larger AUM, or that are managed from the US, generally have longer redemption periods. Funds running risk premia or CTA strategies, with smaller AUM, or that are managed from Europe, have the shortest redemption periods.
Benchmarking is a valuable tool in the hedge fund investor’s repertoire and can be used to determine whether a fund’s terms are reasonable compared to its peers. This analysis has demonstrated how industry data can be used to identify fee and liquidity themes across different strategies, fund sizes and manager domiciles. Every investor may have their own requirements and tolerances for particular terms, however there are clear reasons for certain funds being structured in a particular way.
Hedge fund basics series
See the full series here
-
The Hedge Fund Data Engine is a proprietary database maintained by Aurum Research Limited (“ARL”). For information on index methodology, weighting and composition please refer to https://www.aurum.com/aurum-strategy-engine/. For definitions on how the Strategies and Sub-Strategies are defined please refer to https://www.aurum.com/hedge-fund-strategy-definitions/
Data from the Hedge Fund Data Engine is provided on the following basis: (1) Hedge Fund Data Engine data is provided for informational purposes only; (2) information and data included in the Hedge Fund Data Engine are obtained from various third party sources including Aurum’s own research, regulatory filings, public registers and other data providers and are provided on an “as is” basis; (3) Aurum does not perform any audit or verify the information provided by third parties; (4) Aurum is not responsible for and does not warrant the correctness, accuracy, or reliability of the data in the Hedge Fund Data Engine; (5) any constituents and data points in the Hedge Fund Data Engine may be removed at any time; (6) the completeness of the data may vary in the Hedge Fund Data Engine; (7) Aurum does not warrant that the data in the Hedge Fund Data Engine will be free from any errors, omissions or inaccuracies; (8) the information in the Hedge Fund Data Engine does not constitute an offer or a recommendation to buy or sell any security or financial product or vehicle whatsoever or any type of tax or investment advice or recommendation; (9) past performance is no indication of future results; and (10) Aurum reserves the right to change its Hedge Fund Data Engine methodology at any time and may elect to supress or change underlying data should it be considered optimal for representation and/or accuracy.
Disclaimer
This Post represents the views of the author and their own economic research and analysis. These views do not necessarily reflect the views of Aurum Fund Management Ltd. This Post does not constitute an offer to sell or a solicitation of an offer to buy or an endorsement of any interest in an Aurum Fund or any other fund, or an endorsement for any particular trade, trading strategy or market. This Post is directed at persons having professional experience in matters relating to investments in unregulated collective investment schemes, and should only be used by such persons or investment professionals. Hedge Funds may employ trading methods which risk substantial or complete loss of any amounts invested. The value of your investment and the income you get may go down as well as up. Any performance figures quoted refer to the past and past performance is not a guarantee of future performance or a reliable indicator of future results. Returns may also increase or decrease as a result of currency fluctuations. An investment such as those described in this Post should be regarded as speculative and should not be used as a complete investment programme. This Post is for informational purposes only and not to be relied upon as investment, legal, tax, or financial advice. Whilst the information contained in this Post (including any expression of opinion or forecast) has been obtained from, or is based on, sources believed by Aurum to be reliable, it is not guaranteed as to its accuracy or completeness. This Post is current only at the date it was first published and may no longer be true or complete when viewed by the reader. This Post is provided without obligation on the part of Aurum and its associated companies and on the understanding that any persons who acting upon it or changes their investment position in reliance on it does so entirely at their own risk. In no event will Aurum or any of its associated companies be liable to any person for any direct, indirect, special or consequential damages arising out of any use or reliance on this Post, even if Aurum is expressly advised of the possibility or likelihood of such damages.


