Hedge Fund Data
Hedge fund industry performance deep dive – Q1 2024
In summary…
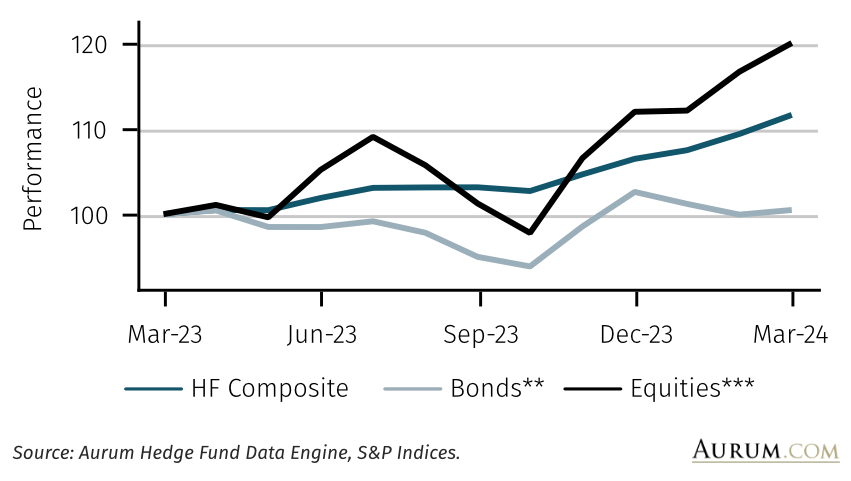
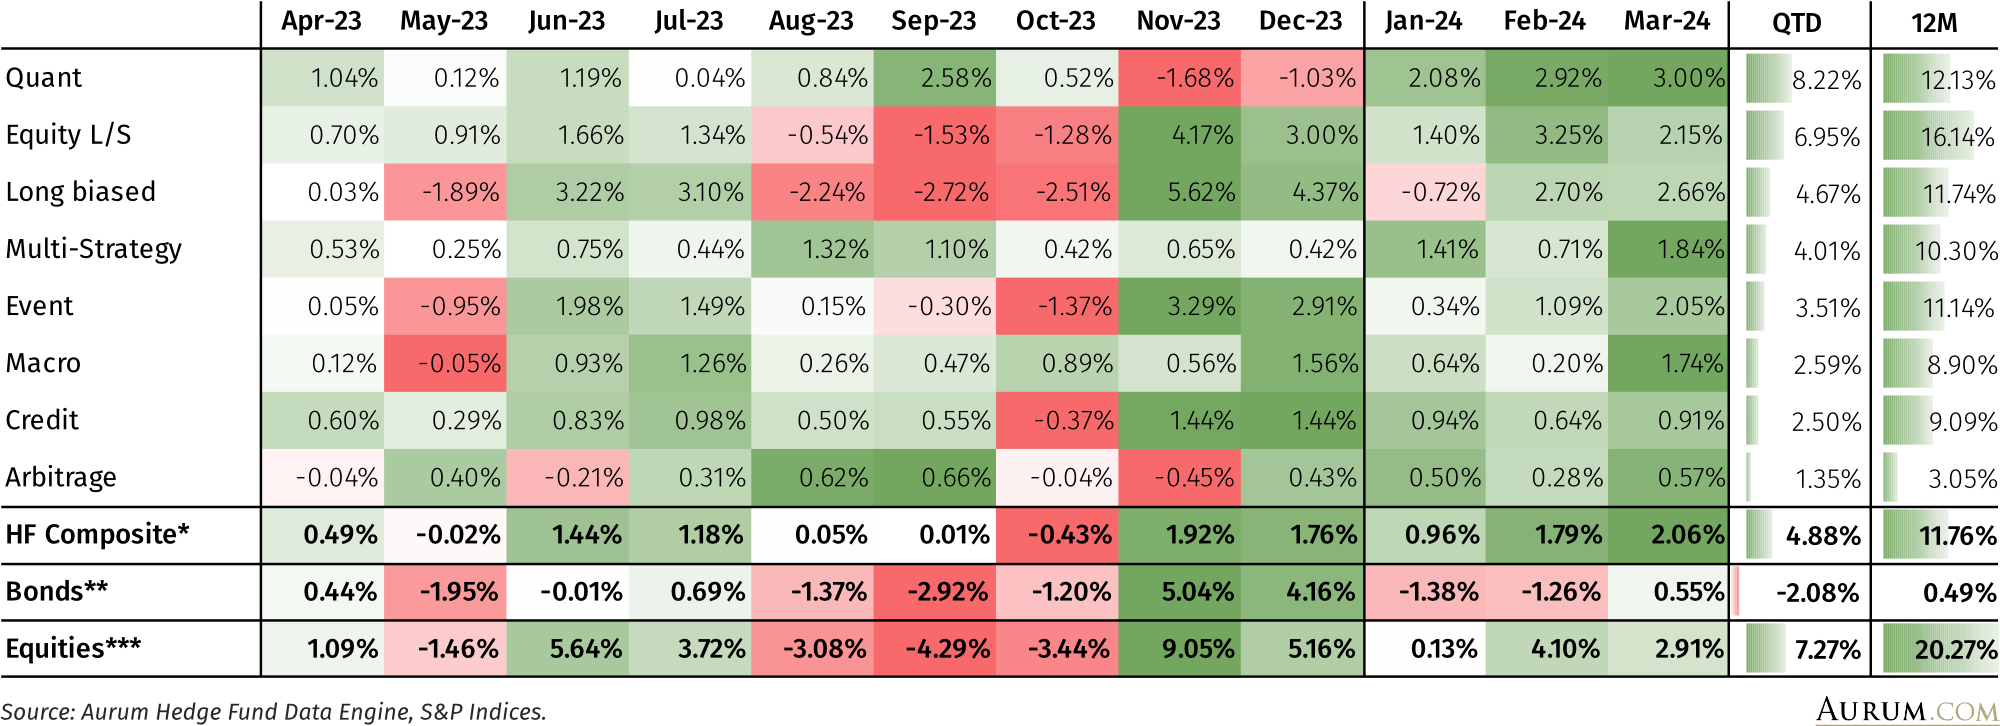
- Hedge funds ended Q1 2024 up 4.9%, outperforming bonds, -2.1%, but behind equities, +7.3%
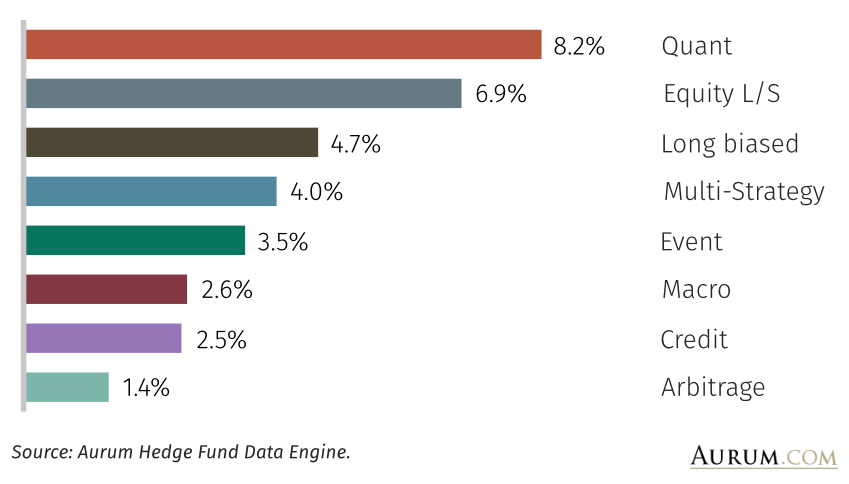
- Quant was the strongest performing master strategy in Q1, +8.2%, after being the joint weakest (with arbitrage) master strategy in 2023
- Quant sub-strategies represented four of the top five performing sub-strategies in Q1
- Arbitrage remains the worst performing strategy, delivering +1.4% in Q1
- While multi-strategy is the fourth strongest performer in Q1 it remains the top performer over five-years with a CAR of 10.6% and the highest Sharpe ratio of 2.2
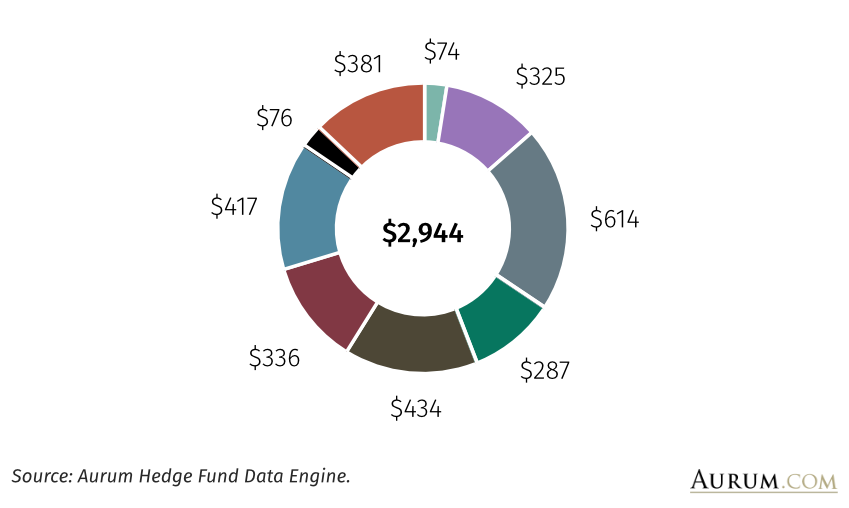
- Industry AUM growth over the quarter was largely driven by P&L; all strategies had negative net flows in Q1 with the exception of quant and arbitrage
- Alt UCITS continue to underperform hedge funds, with the exception of long biased alt UCITS which delivered 5.3% v 4.7% for long biased hedge funds
About Aurum
Aurum is an investment management firm focused on selecting hedge funds and managing fund of hedge fund portfolios for some of the world’s most sophisticated investors. Aurum also offers a range of single manager feeder funds.
Aurum’s portfolios are designed to grow and protect clients’ capital, while providing consistent uncorrelated returns. With 30 years of hedge fund investment experience, Aurum’s objective is to lower the barriers to entry enabling investors to access the world’s best hedge funds.
Aurum conducts extensive research and analysis on hedge funds and hedge fund industry trends. This research paper is designed to provide data and insights with the objective of helping investors to better understand hedge funds and their benefits.
HF COMPOSITE* VS INDICES (1 YR)
NET RETURN (QTD)
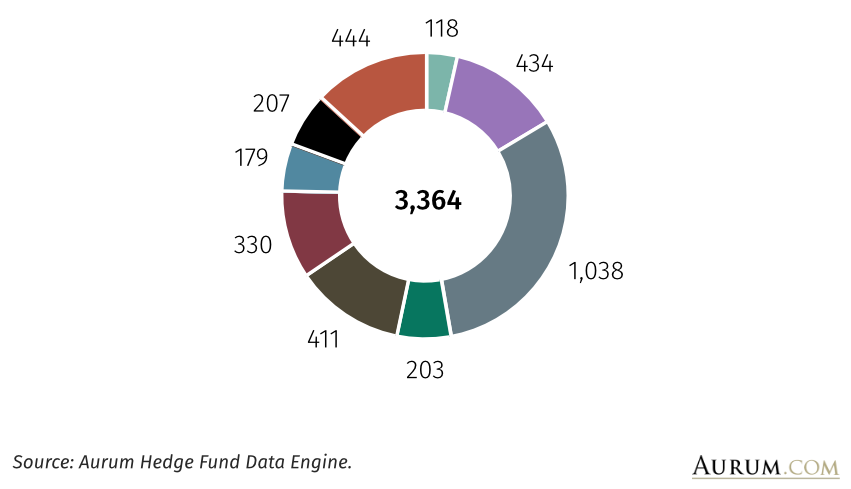
FUND COUNT – MARCH 24
AUM ($BN) – MARCH 24

10th – 90th PERCENTILE 12M ROLLING PERFORMANCE SPREAD
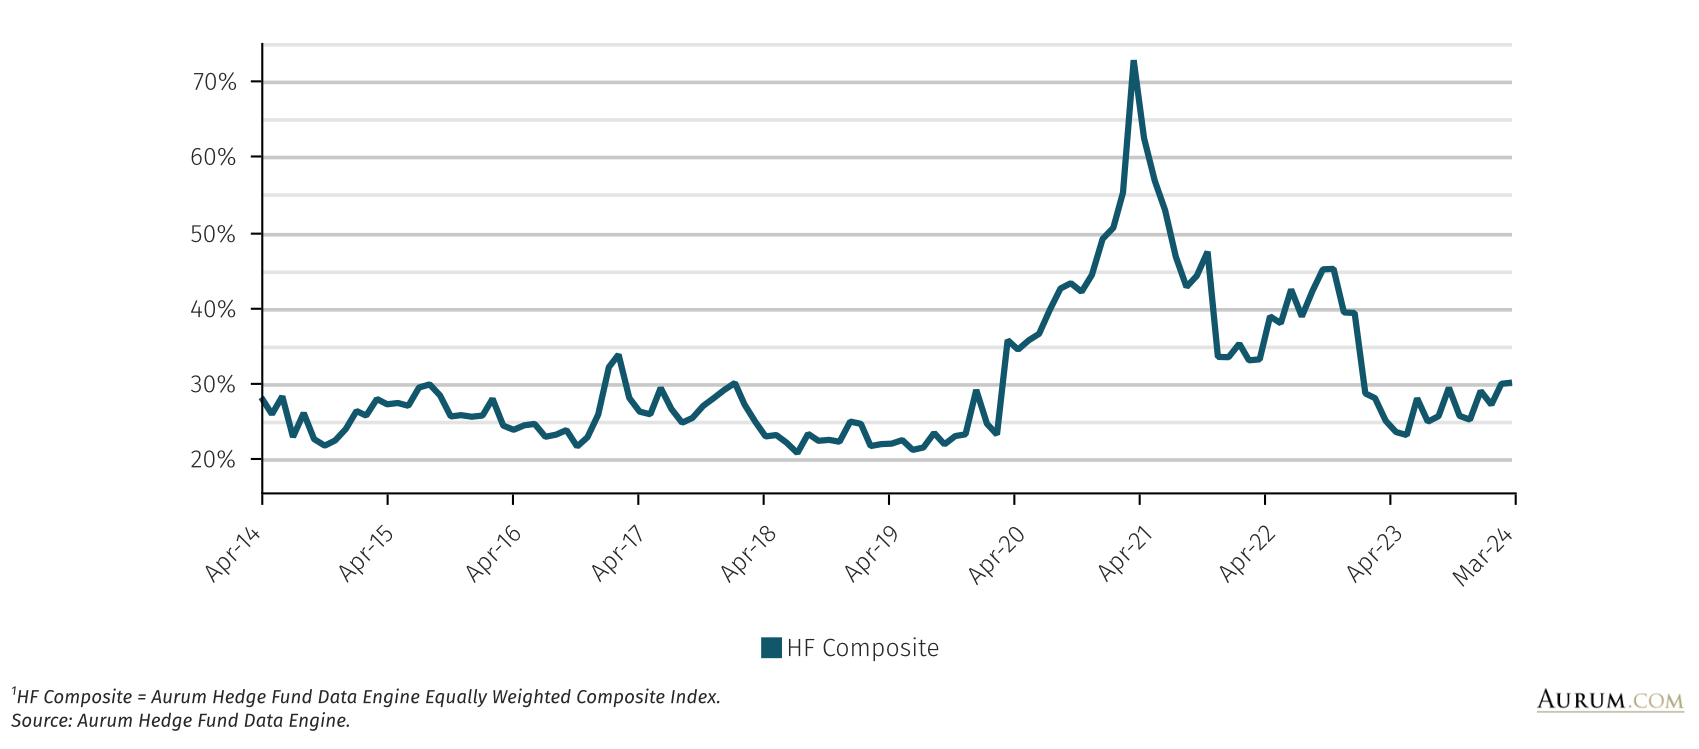
NET RETURN (1 YR)
MASTER STRATEGY MULTIPLE PERIOD – HIERARCHICAL ANNUALISED NET RETURN TO MARCH 2024
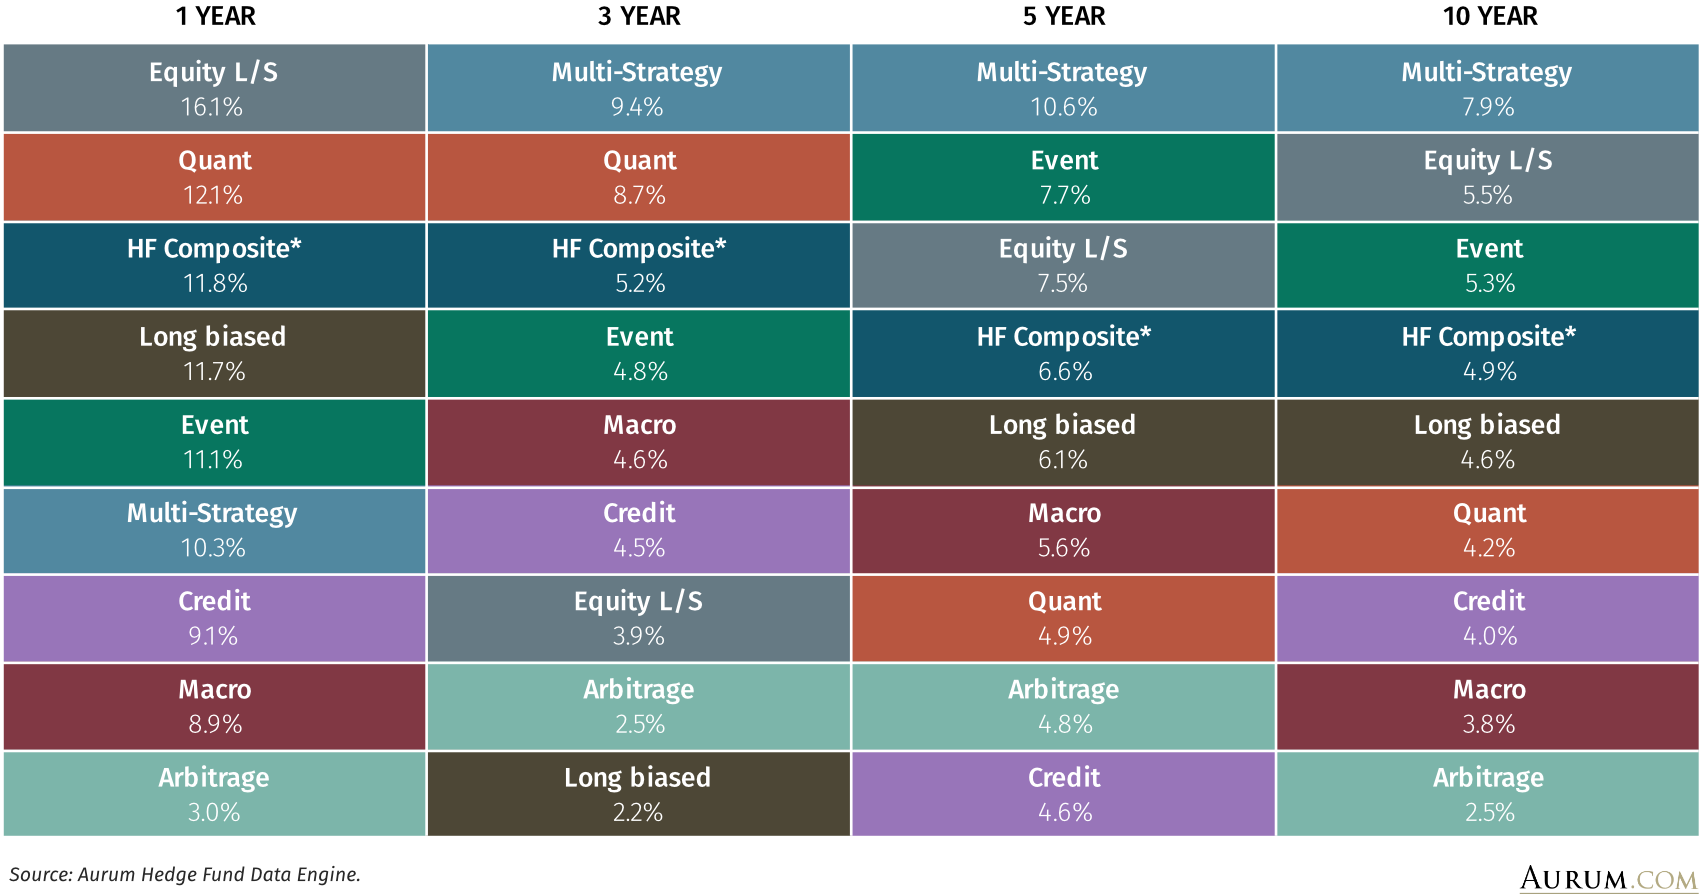
*HF Composite = Aurum Hedge Fund Data Engine Asset Weighted Composite Index.
**Bonds = Bloomberg Global Aggregate Bond USD Index.
***Equities = S&P Global BMI.
All figures and charts use asset weighted net returns unless otherwise stated. All Hedge Fund data is sourced from Aurum Hedge Fund Data Engine. Data included in this report is dated as at 16th April 2024.
The Hedge Fund Data Engine is a proprietary database maintained by Aurum Research Limited (“ARL”). For information on index methodology, weighting and composition please refer to https://www.aurum.com/aurum-strategy-engine/. For definitions on how the Strategies and Sub-Strategies are defined please refer to https://www.aurum.com/hedge-fund-strategy-definitions/
Bond Index
BLOOMBERG® is a trademark and service mark of Bloomberg Finance L.P. and its affiliates (collectively “Bloomberg”). Bloomberg or Bloomberg’s licensors own all proprietary rights in the Bloomberg Indices. Bloomberg does not approve or endorse this material or guarantee the accuracy or completeness of any information herein, nor does Bloomberg make any warranty, express or implied, as to the results to be obtained therefrom, and, to the maximum extent allowed by law, Bloomberg shall not have any liability or responsibility for injury or damages arising in connection therewith.
Equity Index
The S&P Global BMI (the “S&P Index”) is a product of S&P Dow Jones Indices LLC, its affiliates and/or their licensors and has been licensed for use by Aurum Research Limited. Copyright © 2021 S&P Dow Jones Indices LLC, its affiliates and/or their licensors. All rights reserved. Redistribution or reproduction in whole or in part are prohibited without written permission of S&P Dow Jones Indices LLC. For more information on any of S&P Dow Jones Indices LLC’s indices please visit www.spdji.com. S&P® is a registered trademark of Standard & Poor’s Financial Services LLC and Dow Jones® is a registered trademark of Dow Jones Trademark Holdings LLC. Neither S&P Dow Jones Indices LLC, Dow Jones Trademark Holdings LLC, their affiliates nor their third party licensors make any representation or warranty, express or implied, as to the ability of any index to accurately represent the asset class or market sector that it purports to represent and neither S&P Dow Jones Indices LLC, Dow Jones Trademark Holdings LLC, their affiliates nor their third party licensors shall have any liability for any errors, omissions, or interruptions of any index or the data included therein.
By accepting delivery of this Paper, the reader: (a) agrees it will not extract any index values from the Paper nor will it store, reproduce or further distribute the index values to any third party for any purpose in any format or by any means except that reader may store the Paper for its personal, non-commercial use; (b) acknowledges and agrees that S&P own the S&P Index, the associated index values and all intellectual property therein and (c) S&P disclaims any and all warranties and representations with respect to the S&P Index.


