Hedge Fund Data
Hedge fund industry performance deep dive – H1 2023
In summary…
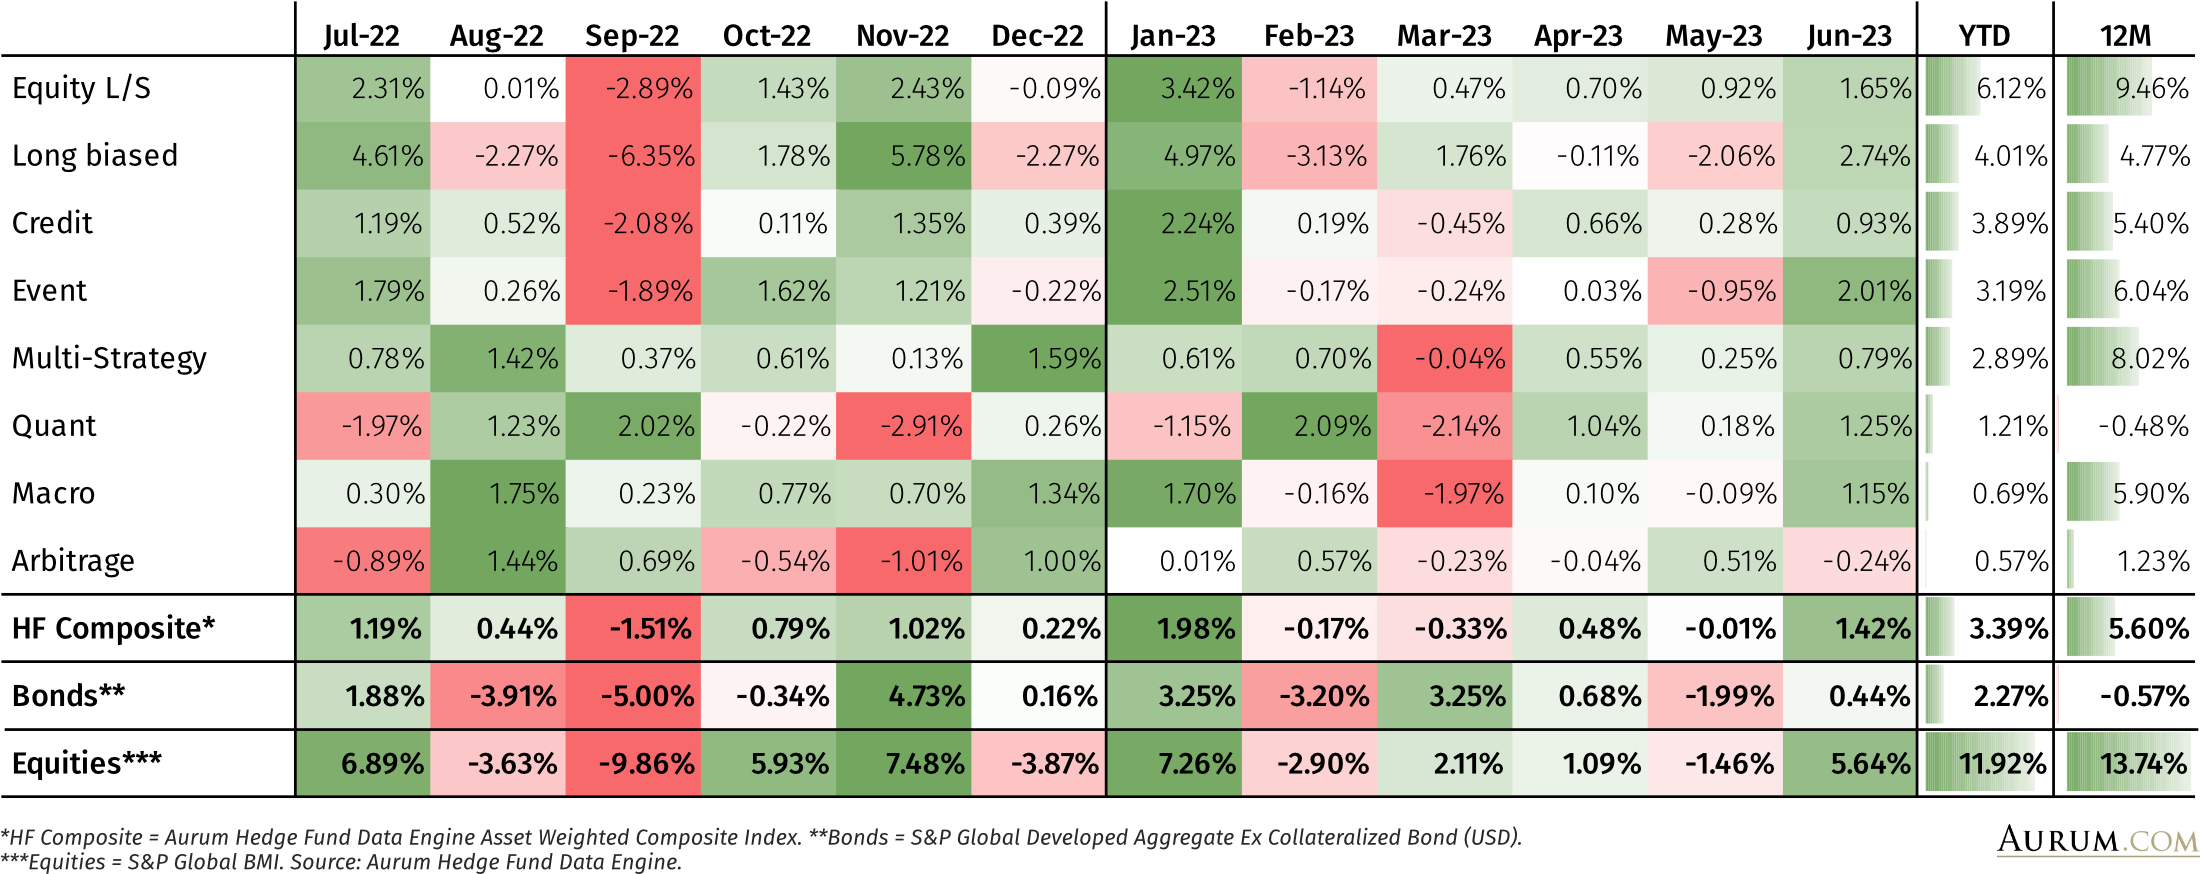
- The hedge fund industry* was up 3.4% in H1 23 with performance being heavily weighted to the start of Q1 and the end of Q2.
- The best performing strategies of 2022 have underperformed significantly in H1 23 as strategies with higher beta to risk assets have led the performance.
- Equity l/s and long biased were the top performers in H1, delivering 6.1% and 4.0 % respectively. These were the worst performing strategies in 2022.
- Five-year performance for hedge funds now stands at a CAR of +4.7%, comfortably outperforming bonds** (-1.3%) but behind equities*** (+5.6%).
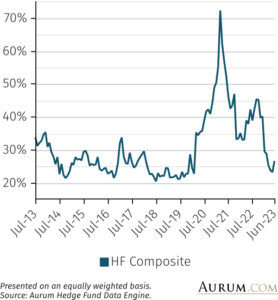
- Dispersion between the top and bottom decile performing hedge funds has fallen significantly.
Hedge fund industry performance review
Asset growth
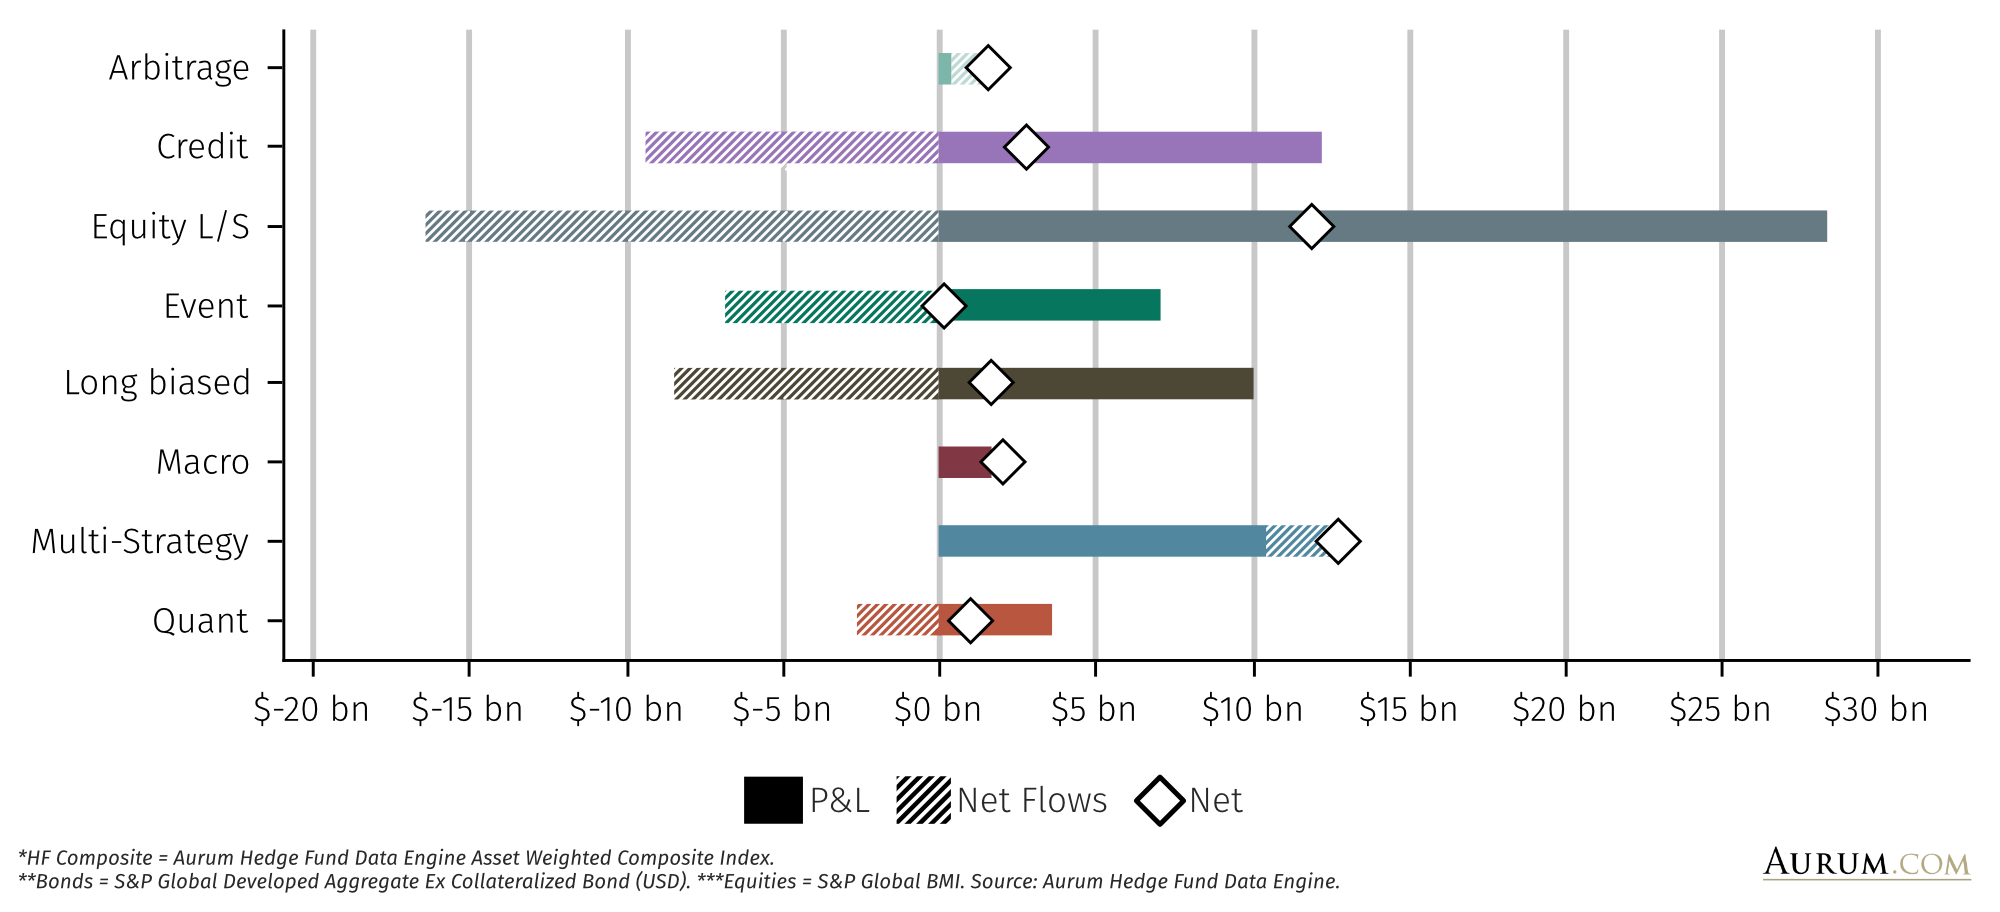
Hedge fund assets – as measured by those funds reporting to Aurum’s Hedge fund Data Engine – have grown by $35.3bn since the end of 2022 to stand at $2.9 tn. This was driven by net positive performance (+$79.4bn) and partially offset by net outflows of $44.1bn. Seven of the eight master hedge fund strategies saw net growth in AUM, led by multi-strategy funds, followed by equity L/S. Multi-strategy fund growth was driven primarily by positive performance and modest capital inflows. Equity L/S growth was entirely driven by net positive P&L, partially offset by capital outflows. Arbitrage and credit saw modest growth in assets; this growth in arbitrage was largely driven by modest positive flows and modest positive P&L. Credit growth was driven entirely by P&L and was partially offset by net capital outflows.
About Aurum
Aurum is an investment management firm focused on selecting hedge funds and managing fund of hedge fund portfolios for some of the world’s most sophisticated investors. Aurum also offers a range of single manager feeder funds.
Aurum’s portfolios are designed to grow and protect clients’ capital, while providing consistent uncorrelated returns. With 30 years of hedge fund investment experience, Aurum’s objective is to lower the barriers to entry enabling investors to access the world’s best hedge funds.
Aurum conducts extensive research and analysis on hedge funds and hedge fund industry trends. This research paper is designed to provide data and insights with the objective of helping investors to better understand hedge funds and their benefits.
Hedge fund assets have grown by $35.3bn since the end of 2022 to stand at $2.9 tn. This was driven by net positive performance (+$79.4bn) and partially offset by net outflows of $44.1bn
CHANGE IN AUM (YTD)
Headline performance
The hedge fund industry was up 3.4% to the end of June and is now back up to its high-water mark after 18 months. The median performing hedge fund sub-strategy, ranking 16th out of the 31 tracked sub-strategies) was up 3.2% (ELS – FEMN), while the median performing hedge fund across the entire universe was up 2.5%[1]. A resurgence in risk assets provided a tailwind to more long biased and/or historically higher beta strategies, such as activist event driven (9.7%), long-biased equity (8.2%), and US equity long/short (8.8%). It should be noted that all of these strongest performing areas were among the worst performing in 2022. For example, US equity l/s was previously down in 2022 10.5%, event – activist was down 9.9%, and long-biased equity was down 18.6%.
NET RETURN (YTD)
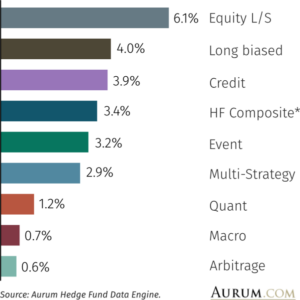
The best performing strategies of 2022 have underperformed significantly in H1 23 as strategies with higher beta to risk assets have led performance.
H1 performance was heavily weighted at the start of the year, and at the end of Q2. The industry was up 2.0% in January, heavily assisted by a huge rally in risk assets. There was positive sentiment aided by falling inflationary pressure, strong growth data and China reopening. Only quant strategies were down during the month. June (+1.4%) saw another very strong month for risk assets, only arbitrage funds were down during the month. Industry performance was marginally negative in Feb, Mar and close to flat in May.
March’s industry negative performance (-0.33%) was predominantly driven by a tough month for macro strategies (both macro – global macro and quant – macro), quant – CTA, and to a lesser extent credit. This will be covered in more detail below.
Few sub-strategies were positive both in 2022 and in H1 2023, so it is worth highlighting macro – FIRV (up 8.3% in 2022 and up 4.9% for the period), multi-strategy (9.0% and 2.9%)2, and quant – stat arb (11.8% and 4.9%) as sub-strategies that have been particularly resilient over the last 18 months.
Five-year performance (CAR) for hedge funds now stands at 4.7%, comfortably outperforming bonds (-1.3%) but marginally underperforming global equities (5.6%) from a total return perspective, however outperforming equities from a risk-adjusted perspective (Sharpe of 0.5 vs 0.3).
Dispersion
As can be seen in the following chart, dispersion between the top and bottom decile performing hedge funds has fallen dramatically, as has general risk asset volatility. Dispersion now sits at a level much more in line with levels observed
pre-COVID.
10th – 90th PERCENTILE 12M ROLLING PERF. SPREAD*
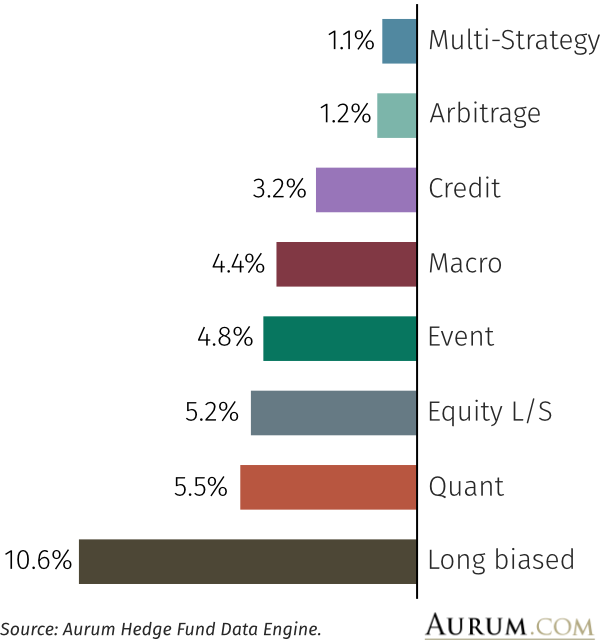
STANDARD DEVIATION (1 YR)
Strategy performance
A pattern has emerged in strategy performance, which is more visible at the sub-strategy level. The best performing strategies in 2022 have underperformed to June 2023, and the reverse is true – that the worst performing strategies in 2022 have been the best performers over the period in 2023. Leading the way so far this year is equity L/S, up 6.1%, having finished 2022 down 9.7%. Credit is up 3.9% having lost 3.8% in 2022, long-biased strategies were up 4.0% losing 14.2% last year, and event strategies were up 3.2% having lost 4.7% in 2022. These are all areas that have sub-strategy components with a higher beta to risk assets, particularly sub-strategies such as event – activist (+9.7%), ELS – US (equity long/short in the US) (+8.8%), long-biased equity (+8.2%), and credit – distressed (+4.2%). During the period global equities have rallied significantly (+11.9%), while global bond performance has been more muted (+2.3%). Last year’s top performing master strategy, multi-strategy, is up 2.9% slightly underperforming the broader universe, however, over the last five years, it remains comfortably ahead of the other master strategies, with a CAR of 9.2% and a Sharpe of 1.8. Arbitrage is the worst performing master strategy in the period (+0.6%) after having posted a modest return in 2022 (+3.4%). Macro has also struggled driven by poor performance from the global macro and commodity sub-strategies; macro – global and macro – commodities were among the worst of all the sub-strategies, down 2.0% and 0.9% respectively, ranking out of 29th and 28th out of the 31 sub-strategies.
NET RETURN OF MASTER STRATEGIES (1 YR)
-
See performance dispersion candlestick chart on page 21 of the report
*HF Composite = Aurum Hedge Fund Data Engine Asset Weighted Composite Index. **Bonds = S&P Global Developed Aggregate Ex Collateralized Bond (USD).
***Equities = S&P Global BMI.
The Hedge Fund Data Engine is a proprietary database maintained by Aurum Research Limited (“ARL”). For information on index methodology, weighting and composition please refer to https://www.aurum.com/aurum-strategy-engine/. For definitions on how the Strategies and Sub-Strategies are defined please refer to https://www.aurum.com/hedge-fund-strategy-definitions/
Bond and equity indices
The S&P Global BMI and S&P Global Developed Aggregate Ex Collateralized Bond (USD) Total Return Index (the “S&P Indices”) are products of S&P Dow Jones Indices LLC, its affiliates and/or their licensors and has been licensed for use by Aurum Research Limited. Copyright © 2021 S&P Dow Jones Indices LLC, its affiliates and/or their licensors. All rights reserved. Redistribution or reproduction in whole or in part are prohibited without written permission of S&P Dow Jones Indices LLC. For more information on any of S&P Dow Jones Indices LLC’s indices please visit www.spdji.com. S&P® is a registered trademark of Standard & Poor’s Financial Services LLC and Dow Jones® is a registered trademark of Dow Jones Trademark Holdings LLC. Neither S&P Dow Jones Indices LLC, Dow Jones Trademark Holdings LLC, their affiliates nor their third party licensors make any representation or warranty, express or implied, as to the ability of any index to accurately represent the asset class or market sector that it purports to represent and neither S&P Dow Jones Indices LLC, Dow Jones Trademark Holdings LLC, their affiliates nor their third party licensors shall have any liability for any errors, omissions, or interruptions of any index or the data included therein. By accepting delivery of this Paper, the reader: (a) agrees it will not extract any index values from the Paper nor will it store, reproduce or further distribute the index values to any third party for any purpose in any format or by any means except that reader may store the Paper for its personal, non-commercial use; (b) acknowledges and agrees that S&P own the S&P Indices, the associated index values and all intellectual property therein and (c) S&P disclaims any and all warranties and representations with respect to the S&P Indices.


